Click here to access Github repo containing relevant code or continue reading below on for non-technical description of the project.
Technologies/Skills Used
Problem Description
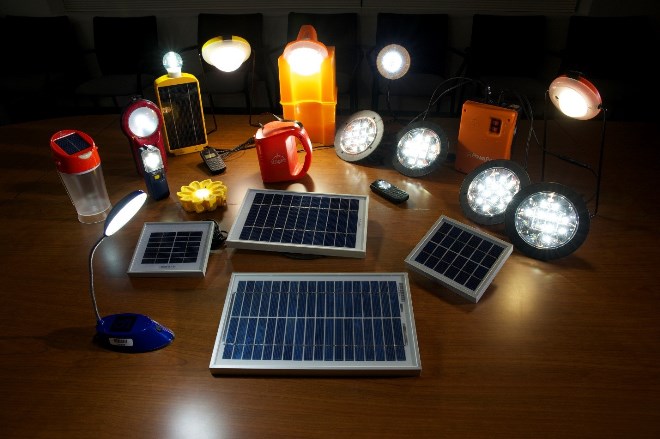
Millions of people in Nigeria lack access to electricity, either through intermittent power delivery via the national grid or lack of transmission lines that can reach their household. As we move towards a decarbonized future, off-grid solar power provides a powerful tool to address both energy poverty and climate change. Currently, individuals living off-grid either lack electricity or rely on diesel generators for power and often turn to kerosene lamps for light. Consumer grade photovoltaic systems can provide light and power generation, keeping money in consumers’ pockets and preventing carbon from entering the atmosphere.
However, enterprises or development partners seeking to find the best places to introduce or expand sales of off-grid solar products do not always have access to the the best geospatial information.
Solution
I curated, cleansed, and published location-based data using Mapbox rendered in a React-based website.
Data visualizations built using a combination of R and Altair, a Python data visualization package. With our work, Nigerian solar companies, development practioners, and more can better execute market expansion of off-grid solar devices.