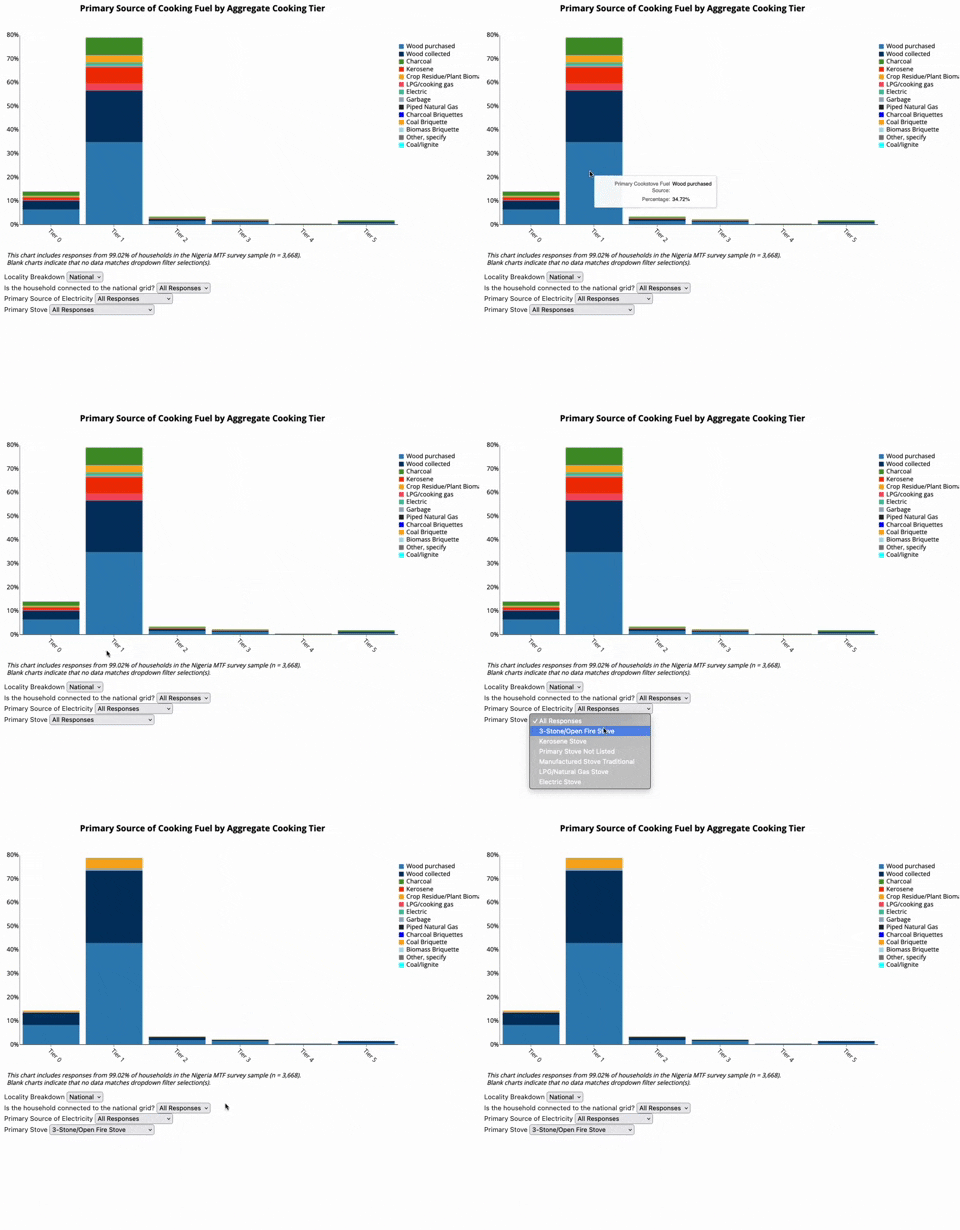
Click here to access Github repo containing relevant code or continue reading below on for non-technical description of the project.
Problem Description
Lack of access to energy for lighting and cooking presents a formidable obstacle to development in Nigeria. Solar energy in particular could play a meaningful role in alleviating energy poverty. In order to provide basic information about electricity as well as cooking fuels, the World Bank conducts “Multi-Tier Framework” surveys in conjunction with host nations. For Nigeria, survey teams interviewed over 3,500 households. While the trove of data is public, it is also difficult to parse, requires additional cleaning, and is hard to understand without additional visualizations.
Solution
As an analyst as Catalyst Off-Grid Advisors,
I am currently building data visualizations using a combination of R and Altair, a Python data visualization package. With our work, Nigerian solar companies, development practioners, and more can leverage the MTF survey data to inform their decision making.

Note: MTF Nigeria survey data visualizations not yet released publically.