Unfortunately I can’t share the code for this project publicly, but you can click here to access my Github repo containing code for other projects.
Technologies/Skills Used
Problem Description
The United States Bureau of Transportation Statistics (BTS) reports that only % of flights depart on time. The Air Traffic Controllers (ATC) of the Federal Aviation Administration (FAA) are responsible for coordinating departures at US airports. The sooner ATCs can receive information on which flights are likely to depart late, the better they can plan mitigation strategies to ensure smooth airport operations. In this project, I, along with four other UC Berkeley data science graduate students, analyzed data from the BTS and National Oceanic and Atmospheric Administration (NOAA) from 2015 through 2020 to predict the difference between scheduled and actual departure time of flights leaving from US airports in 2021. Specifically, we predict departure delays given information no sooner than 2 hours before expected departures. We theorized that by predicting the magnitude of delay rather than just the presence or absence of a delay, ATCs will be better positioned to optimally allocate resources to start resolving high-priority problems before they arise. Additionally, we implemented a Multilayer Percpetron via MLlib to classify flights as either 15 minutes late or not.
Data Pipeline
We employed a two step processs in order to prepare for modeling. In the first step, we joined the roughly 74,000,000 flight records from the BTS and the 890,000,000 weather station records from NOAA by using a composite key to match airports to weather stations on place and time. Weather records came from about 7,000 unique weather station and the 371 airports were matched by location using Haversine distance and joined on time to the nearest hour. Following the join, which took only about 20 minutes, we moved onto create a variety of features. A synopsis of the process is illustrated below:
Modeling Pipeline
We utilized MLlib pipeline with Spark DL XGBoost along with cross fold validation and hyperparameter tuning to make our predictions. We used Root Mean Squared Error (RMSE) as our performance metric. Importantly, our folds created train and validation sets from flights across different years. Since we predicted departure delays for flights in 2021 from data gathered from 2015 to 2020, a time series approach my team determined that actually backfire. If we had weighed the previous year’s contributions to the model more than the year before the previous year then the last year of our training data, 2020, would have an outsized effect on predictions in 2021. For example, average departue delays drop from about 9-10 minutes in 2015-2019 down to only 2 minutes in 2020, due to the steep drop in air traffic. Given the anomolous nature of 2020 with the COVID pandemic, we did not treat the problem as a “true” time series task. Consequently, our cross validation created folds across years while retaining month of year, day of week, time of day features to preserve the importance of time in predicting flight departure delays while not producing a model overly sensitive to anomolous training data. A diagram of the modeling process describes outlines each step below:
Results
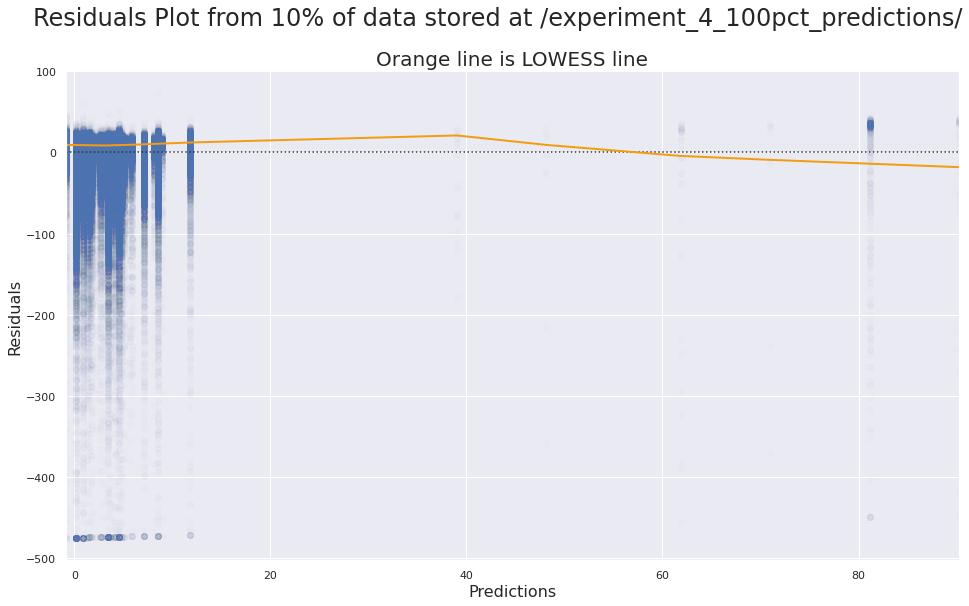
After preprocessing and modeling, our Spark DL XGBoost algorithm to achieved a RMSE of about 33 minutes. Flight delays had a long right tail. For instance, flight records show a median of -1 minute (a 1 minute early departure) but an average of about 10 minutes late. As evidenced, by the residuals plot below, we struggled with the numerous flights that had extreme departure delays.

Next steps include deeper error analysis into flights with large departure delays, more extensive hyperparameter tuning, an improved PageRank feature (which we used by was not favored by the model), and finally a new pipeline with a multitask loss function to marry the benefits of a neural network classifer alongaside the boosted regression trees provided by XGBoost.
Photo credits:
- Banner: https://www.traveldailymedia.com/chicago-ohare-airport-begins-usd-334-million-runway-extension/

